Visualization is a key part of microarchitectural analysis. Visualization is necessary because even the simplest in-order processor is incredibly complex; its performance may be affected by cache misses, branch mispredictions, pipeline stalls, DRAM contention, inaccurate prefetching, and so on. In any given cycle, there could be a hundred things going on in the processor that have impact on performance. The most efficient way to convey such complexity to the brain is visualization.
Most microarchitecture visualization tools are pipeline-centric. For example, here’s a annotated screenshot of an industrial pipeline visualization tool (this picture comes from an old Intel presentation):
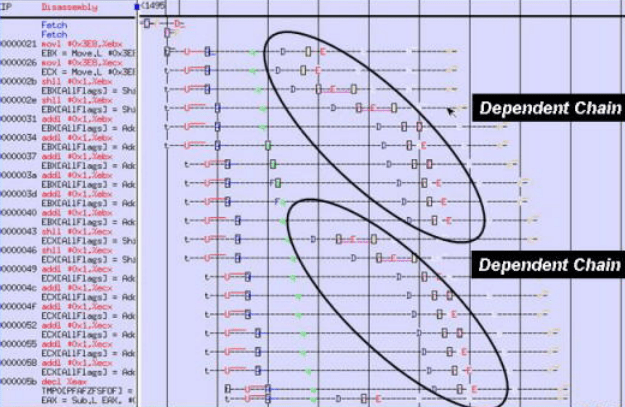
In this style of visualization, instructions are listed in program order from top to bottom, and processor cycles are shown left to right. Each single letter symbol represents some microarchitectural event. In our research group simulator, we have a similar visualization tool (borrowed from gem5):
 These pipeline-centric visualization tools are very useful for analyzing single core performance; they show effects of instruction dependencies, cache misses, and wrong path execution.
Unfortunately, these tools are not as useful for analyzing multi-core performance. When multiple programs or threads are running on a multi-core processor, they contend for shared resources, such as last level cache capacity and DRAM bandwidth. Often, this contention is a major factor in performance. However, pipeline-centric visualization tools cannot adequately represent shared resource contention and therefore fail to show the full picture.
In my research, I’ve been using a different, memory-centric kind of microarchitecture visualization to analyze shared resource contention. Here is an annotated screenshot (for simplicity, I only show two cores and four DRAM banks):

This style of visualization is much more useful for analyzing shared resource contention than the traditional pipeline-centric style. I am currently using this visualization style to look at DRAM contention only; that’s why there’s no shared cache contention shown. However, this visualization style can be easily extended to show shared cache contention as well.
