While working on a recent paper, I stumbled on an easy way to find errors in a computer architecture simulator. I simulated a processor at various frequencies and plotted the resulting performance. I expected to see a nice “smooth” set of points, perhaps something like this:
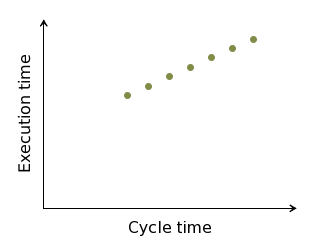
Aside: in my paper, I explain why looking at execution time vs. cycle time is easier than looking at performance vs. frequency.
Instead, I saw a big jump in performance at a certain frequency point. The plot I got looked more like this:
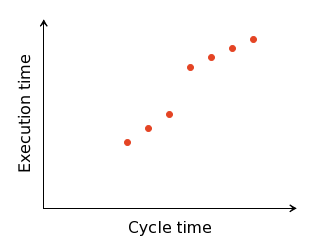
Naturally, I investigated. It turns out that this particular workload (lbm) generates a lot of writeback memory requests. At high frequencies, these requests saturate the capacity of the buffers holding them. So sometimes a writeback is generated without an available buffer to hold it. The person who wrote the writeback code (who shall remain unnamed) assumed that this scenario would not occur often and chose to simply drop the writeback. Well, this scenario does occur often when running lbm at high frequencies, causing many dropped writeback memory requests. In turn, the drop in memory requests reduces off-chip memory contention, causing an unexpected performance improvement—the big jump in the plot.
Of course, I fixed this simulation inaccuracy, and a few others. I also learned a new way to detect simulator errors.
